

Sign in

Want to know what's really happening in the benefits market? We break it all down in this report.
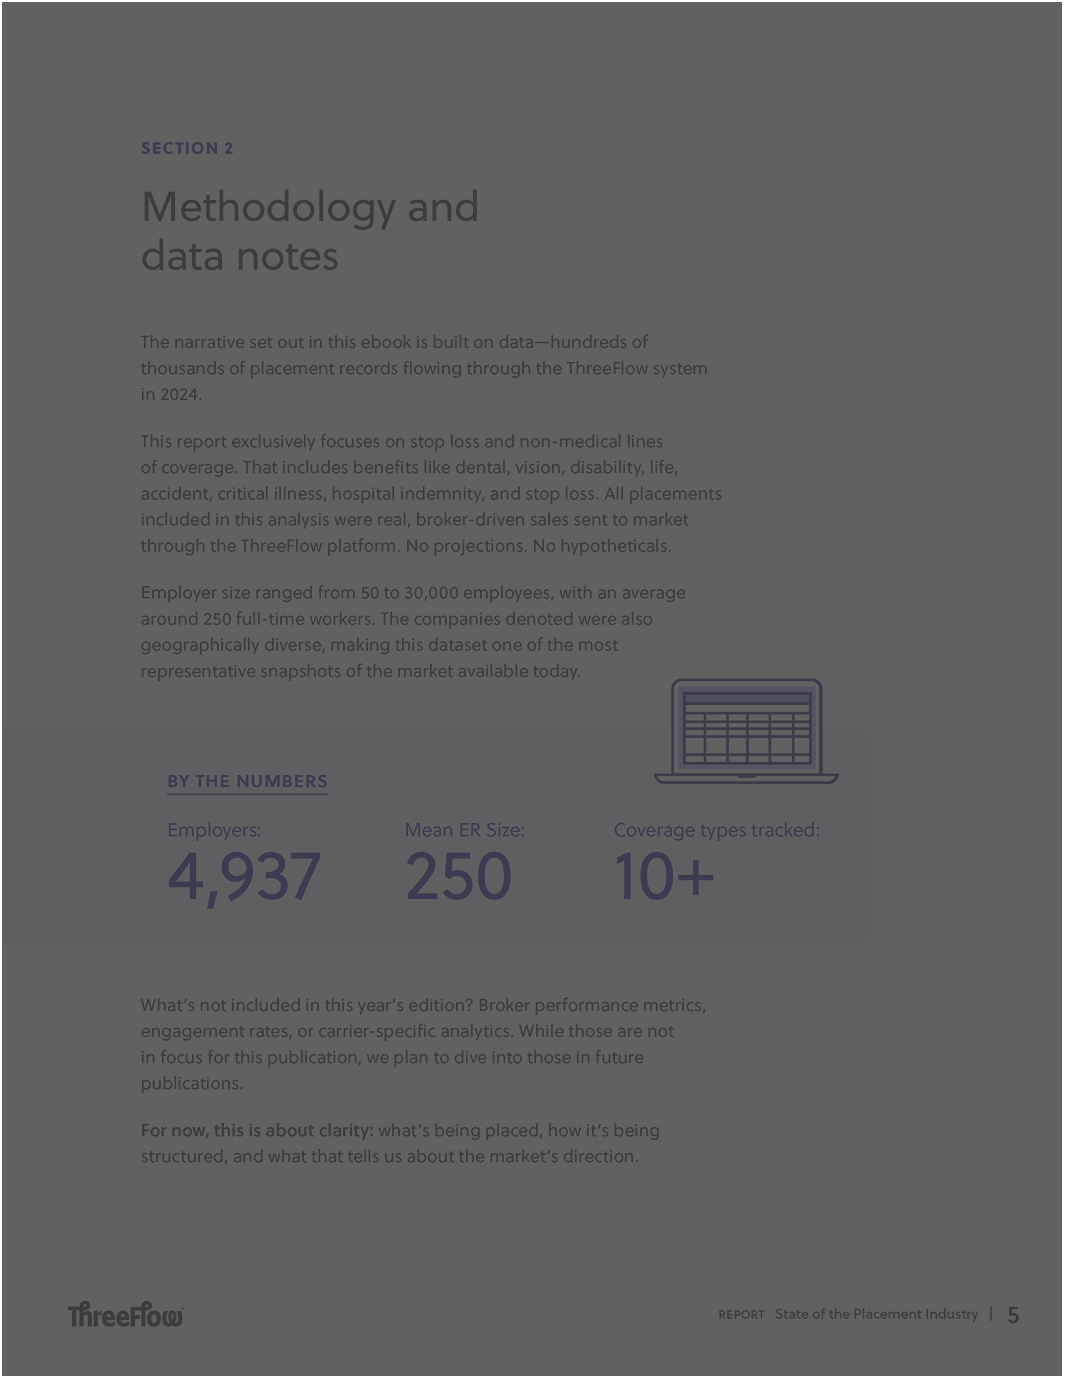
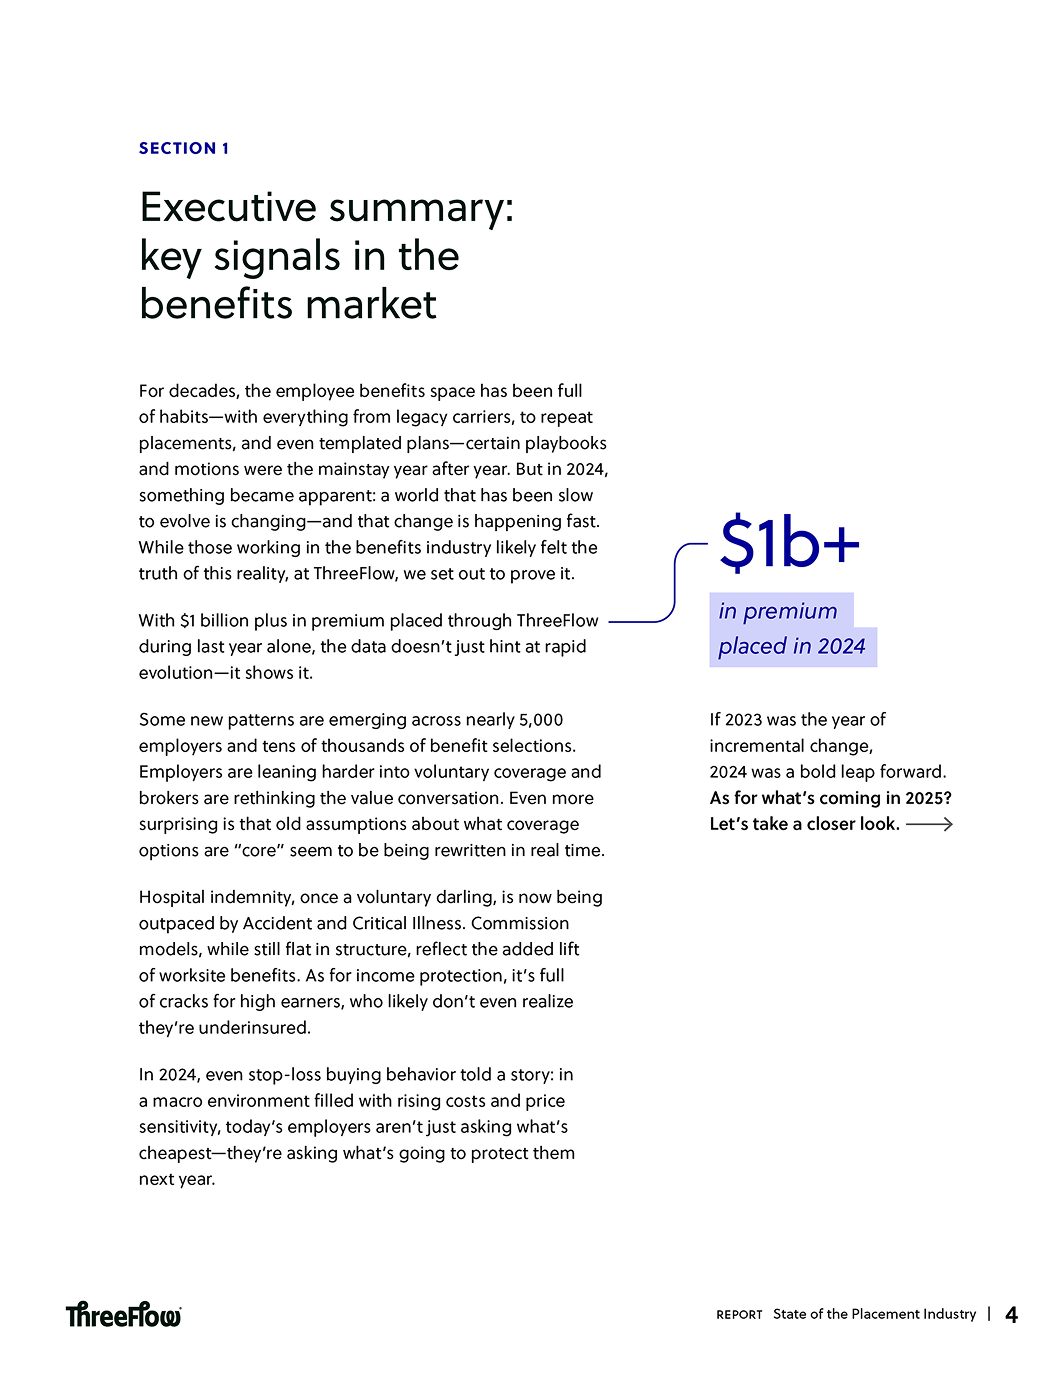
Based on real placement data—not surveys—from nearly 5,000 employers and over $1B in premium, this report shows what's getting placed, which coverages are trending, how plan designs are changing, and how brokers are getting paid.
We're sharing insights you won't find anywhere else, straight from the system hundreds of brokers use to manage renewals and RFPs. This is the first report of an annual series; future reports will include even more lines of coverage, deeper trends, and year-over-year comparisons.


of stop loss policies included a "no new laser" guarantee showing that employers are choosing stability over price.
Critical Illness plans most commonly offer just a $12,500 benefit, even though the average cost of a critical illness in the U.S. is nearly $60,000.

.webp)


.webp)


